Join the discussion

Write your take first — we'll ask for email only when you're ready to publish.

  • Hacker News
  • For the layer data, it seems they use a custom protocol to compress it.
  • Side note: it pretty much floods the browser navigation history. Instead of pushing a new entry in history, you might want to `window.location.replace(newCoordinates)`
  • Is this used as data and visualisation for windy.com?

    I always thought it was their proprietary software. Nice!

  • I suspect both of these (and other weather / meterological visualisers) draw on the same data sources.

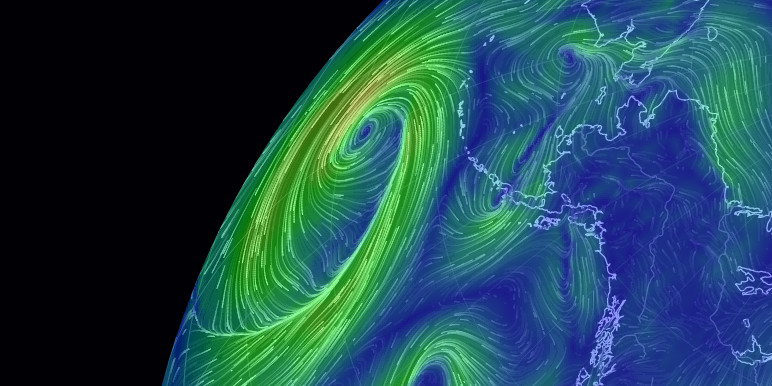
    Nullschool lists its sources on the "about" page. Weather data generally come from GFS (Global Forecast System): EMC / NCEP / NWS / NOAA.

  • A fave of mine for much of the past decade, part of my morning info review and frequently consulted during various events (fires, storms, heat- and cold-waves, aurora, etc.).

    The site has an absolute wealth of meterological data. Wind is just the start. Temps, precipitation potential, mean sea level pressure (MSLP) --- which can give a heads-up on tropical storms, particulates, pollutants (tracking air and sea routes by SO2/NO2 prevalence is fascinating, I recommend looking at past years' traces around the Cape of Good Hope to see the impacts of Red Sea attacks), wildfires (not just "Fires" under the Bio tab, but CO, SO2, and particulates), sea temps, aurora, ...

    On sea temps, contrast current mid-Pacific readings with a year ago, to see the scope of El Niño:

    August 14, 2026: <https://earth.nullschool.net/#current/ocean/surface/currents...>

    August 14, 2025: <https://earth.nullschool.net/#2025/08/13/1200Z/ocean/surface...>

    Oh, and there's not just forecasts (up to about a week), but history dating to 2013, so that it's possible to compare conditions over time.

    Other tweaks and twiddles: atmospheric conditions can be reported for a given altitude, from surface to remote stratosphere; grid density can be set low or high; interpolation can be enabled or disabled (values given are the average within a grid, this is particularly apparent when trying to estimate maximum wind speeds from a localised storm, for which this tool is poorly suited), and alternative map projections (ObXkcd: <https://xkcd.com/977/>)

  • Precious submission's titles are more informative:

    > Nullschool Earth – Weather forecast by supercomputers updated every three hours

    > Earth: A global map of wind, weather, and ocean conditions

  • If the goal is to allow arbitrary rotations and not treat poles as special, you need quaternion rotation, instead of pitch/yaw with unlocked pitch.
  • Nice to have web bulb temps available as that is a true measure of comfort level for humans.
  • One of the rare resources on the net that allows you access to resources not normally obtainable, and the 3d globe view is also equally rare when scouting out larger regional weather.
  • Clicking and dragging the different map projections is a fun exercise too
  • In addition to NOAA Hysplit modeling and weather underground’s graphics for forecasting, this is my go to student intro for our high altitude balloon launches. You really get a sense of a living Earth
  • I used to work with the developer of this. Great guy, and my memory is that he originally built this to teach himself Javascript. I think he may have learned that successfully.
  • It's a total classic. Earlier this year I forked it, and added volcanoes, eclipses, time zones and more. Here

    https://earth-clock.onemonkey.org/

  • I am of the opinion that this kind of approach, and showing appreciation for this type of approach, amounts to belittling people’s efforts. I don’t think it is right. Additionally, the website you mentioned doesn’t even open.
  • I was noticing that when I grab and spin the globe, most of the river systems shown on the map disappear (as do the wind flow indicators). But a few major river systems still remain on the map.

    In the United States, I thought it was interesting that the Missouri River (which starts in Three Forks, Montana) was chosen as that river. I assume the choice was because this is the longest river, but maybe not quite as well known as the Mississippi river perhaps. And I would guess that not everyone knows the Missouri starts in Montana.

    When you let go of the grab, other rivers are redrawn. For the US, that includes the major river systems (including the other major contributors to the Mississippi), which makes sense.

    Interesting visualization is all.

  • Where the Missouri and Mississippi meet, they each contribute roughly 50% of the water. The Mississippi was better known, so the Missouri became the "tributary" in name.

    If the opposite decision had been made, the river would be even longer in the books.