
Discussion summary
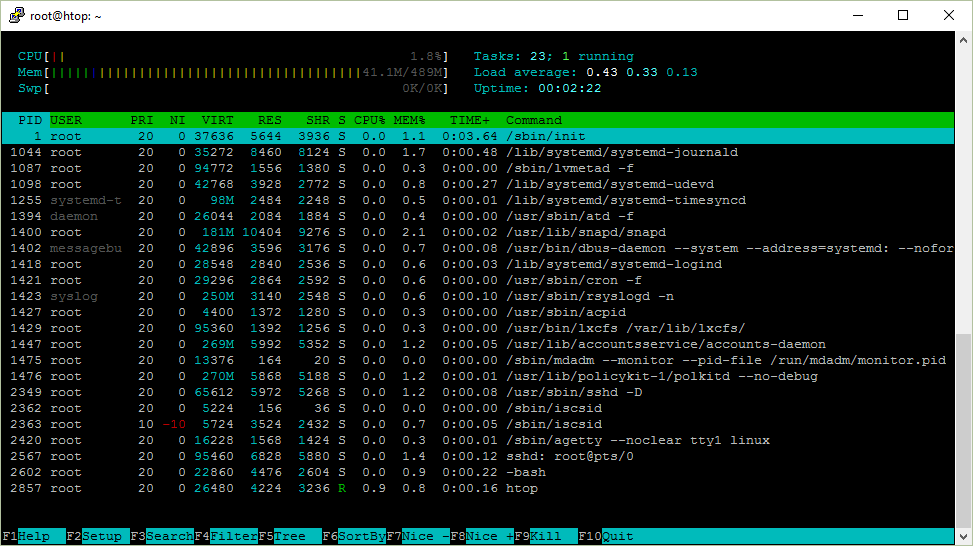
Users discuss the limitations of htop/top in showing system metrics like power consumption. Alternatives like powertop and btop are suggested, with some preference for different interfaces and functionalities.
What the discussion says
- powertop is recommended for power metrics.
- btop offers a different interface, but opinions vary.
- htop is mainly used for process management, not detailed metrics.
“A bit silly that you can see a load average but not Watts used.”
“powertop to the rescue!”
Comments
Hacker News
by amelius
by roryirvine
You'll be glad you did.
by MomsAVoxell
by allarm
by love0972
/*
* kernel/sched/loadavg.c
*
* This file contains the magic bits required to compute the global loadavg
* figure. Its a silly number but people think its important. We go through
* great pains to make it work on big machines and tickless kernels.
*/
so is it just silly numbers or important ?by Maksadbek
by leephillips
I use htop often but pretty much only use it to find pid or cpu-culprits, and never really understood the rest.
by TheChaplain
by bwnkl
by cb321
by wyclif
https://nmon.sourceforge.io/pmwiki.php
Especially disk throughput and I/O (keys "d" & "D") can be very useful.
by zepearl
by Zardoz84
by shellwizard
by thijson
by yomismoaqui
by fractorial
by conqrr
by wonnage
by WD-42
There's actually guides out there on the web that tell people judge usage by virtual memory allocated too :(. At least this article gets it right :).
by AnotherGoodName
by hinkley
by jltsiren
Actually, Proportional Set Size is more accurate than RSS. See: https://en.wikipedia.org/wiki/Proportional_set_size
by d3Xt3r
Just to clarify, Windows Task Manager uses Private Working Set by default for process memory usage which does NOT include shared pages with other processes such as libraries or memory mapped files (hence the name “private”). It only shows the memory that maps to privately allocated physical memory per process. It’s probably closer to Resident Set on Unix.
You probably meant the memory usage in performance tab but I wanted to clarify in case people mistake it for all memory usage fields.
by sedatk
1. I disable user threads. Those mostly just clutter up the htop view while providing no useful information.
2. I enable the process tree view. Very frequently, where a process comes from is much more important than other information. It also lets you see and track things like a compiler process which is eating through a bunch of files.
IMO, both these things should be the default behavior of htop.
by cogman10
by zekrioca
As others mention it - it seems to shows the Watts used as well :) (and network, and GPU, and disks,....)
by imrehg
by zackify
by MomsAVoxell
Join the discussion
Write your take first — we'll ask for email only when you're ready to publish.
- Hacker News
- A bit silly that you can see a load average but not the amount of Watts used by your system.by amelius
- powertop to the rescue!by roryirvine
- s/htop/btop/
You'll be glad you did.
by MomsAVoxell - What's so good about btop? I personally can't stand its interface, I don't need bells and whistles in my terminal.by allarm
- Very interesting topic,Cool.by love0972
so is it just silly numbers or important ?/* * kernel/sched/loadavg.c * * This file contains the magic bits required to compute the global loadavg * figure. Its a silly number but people think its important. We go through * great pains to make it work on big machines and tickless kernels. */by Maksadbek- Seems clear to me: it’s a silly number that people think is important. Like the Dow, H-index, GNP, ...by leephillips
- This is really good!
I use htop often but pretty much only use it to find pid or cpu-culprits, and never really understood the rest.
by TheChaplain - For pid I find pgrep to be the better suited toolby bwnkl
- A different usage paradigm from *top that I have come to like better is to do differential ps-like reports and system-wide (like vmstat) reports which leaves everything in your terminal scrollback buffer as in: https://github.com/c-blake/procs { written in the uncommonly efficient, expressive Nim programming language }.by cb321
- I've had this bookmarked since 2016, and have referred to it many times over the years.by wyclif
- For the ones that don't know "nmon", have a look at it as well! (press "h" to see the list of available monitors - press it again to make it go away, press "q" to quit)
https://nmon.sourceforge.io/pmwiki.php
Especially disk throughput and I/O (keys "d" & "D") can be very useful.
by zepearl - very useful tool. I install it on every machine where I have control. I appreciate the "Wide" CPU usage graph, that can handle huge core counts easilyby Zardoz84
- I know it from some AIX machines that we have at job, also topas comes to mindby shellwizard
- For top if you use the > character it will sort by memory usage. I use that sometimes to figure out why my host is becoming laggy. Also you'll see swapd is taking up CPU.by thijson
- I prefer using the more memory friendly M (uppercase) for memory and P (uppercase) for CPUby yomismoaqui
- Anyone else feel as if HN is healing? I hope this isn't the walking-ghost era of HN.by fractorial
- 3 AI related articles on the front page, but one is busting slop. I'm hopeful.by conqrr
- Healing by reverting to seven year old pre-slop articles :)by wonnage
- When I read stuff like this, I come to the realization that even after daily driving Linux for 20+ years I still barely utilize its full potential. Great article.by WD-42
- I appreciate the note on virtual memory not being reliable. This is what Windows task manager reports by default and it's terrible. Resident size is the most reliable metric. Anything else can be wrongfully inflated by things like harmless memory mapped files that won't actually hurt anything. eg. memory map 2GB of logfiles, it'll only be paged in if reading that portion of the logfile so isn't really using memory but users look at the processes and claim "OMG why does this app use so much memory". It doesn't. It uses very little. You're reading the memory usage wrong. Chrome actually had this problem for a while and they moved away from using memory mapped files. Not because memory mapped files are a bad thing but because users will read the memory usage and go crazy over what they see even though it's not really using that much actual physical memory.
There's actually guides out there on the web that tell people judge usage by virtual memory allocated too :(. At least this article gets it right :).
by AnotherGoodName - Resident set size is not the amount of memory that the process wants, it’s how much the OS is willing to give it. So once memory pressure kicks in it stops being representative. I’ve seen this misunderstanding lead to bad decisions a few times. I even went so far to remove this value form charts because a team member was going left when he should have gone right.by hinkley
- If you use memory-mapped files, cached pages count towards the resident set size of your process. If you use ordinary file I/O, they don't. That behavior has amusing consequences in HPC clusters that monitor the memory usage of each job and kill them if they use more memory than they requested.by jltsiren
- > Resident size is the most reliable metric
Actually, Proportional Set Size is more accurate than RSS. See: https://en.wikipedia.org/wiki/Proportional_set_size
by d3Xt3r - > This is what Windows task manager reports
Just to clarify, Windows Task Manager uses Private Working Set by default for process memory usage which does NOT include shared pages with other processes such as libraries or memory mapped files (hence the name “private”). It only shows the memory that maps to privately allocated physical memory per process. It’s probably closer to Resident Set on Unix.
You probably meant the memory usage in performance tab but I wanted to clarify in case people mistake it for all memory usage fields.
by sedatk - 2 Settings I change on every htop which makes a HUGE difference.
1. I disable user threads. Those mostly just clutter up the htop view while providing no useful information.
2. I enable the process tree view. Very frequently, where a process comes from is much more important than other information. It also lets you see and track things like a compiler process which is eating through a bunch of files.
IMO, both these things should be the default behavior of htop.
by cogman10 - I like the process tree view, but it stops the dynamic updates and reordering of process list.by zekrioca
- I've relatively recently migrated over to using btop[0], and it's the kind of modern interface, useful and informative, that I needed.
As others mention it - it seems to shows the Watts used as well :) (and network, and GPU, and disks,....)
by imrehg - Same. Btop is the bestby zackify
- Yup, btop zealot here, it even replaced iStatMenu on my brand new MacBook ..by MomsAVoxell
Related stories
Why skilled workers come to Germany and then leave again
dw.com · 281 points · 785 comments
Decoding the obfuscated bash script on a Uniqlo t-shirt
tris.sherliker.net · 1072 points · 181 comments
StreetComplete: Fixing OpenStreetMap, one tiny quest at a time
streetcomplete.app · 761 points · 182 comments
Every new car sold in the European Union must include a driver monitoring camera
allaboutcookies.org · 737 points · 969 comments
Chat Control 1.0 and 2.0 Explained
fightchatcontrol.eu · 645 points · 238 comments
Microsoft fire idTech team at Id software
gamefromscratch.com · 597 points · 533 comments